
Activity Up, Prices Soft — What Smart Sellers Need to Know
The Greater Toronto Area housing market saw its strongest July performance since 2021, with 6,100 homes sold — up 10.9% year-over-year — as more buyers returned to the market. Sales also jumped 13% month-over-month, marking the second straight month of rising activity.
However, average selling prices remained lower at $1,051,719 — down 5.5% year-over-year — and the MLS® Home Price Index benchmark edged down 0.2% from June.
More listings also came to market (17,613 new listings, +5.7% YoY), giving buyers more choice and negotiating power.
Translation for Sellers: Sales are happening — and in some areas at a brisk pace — but the properties moving are the ones priced competitively for today’s conditions. Overpricing in hopes of “testing the market” often results in longer days on market and eventual price reductions.
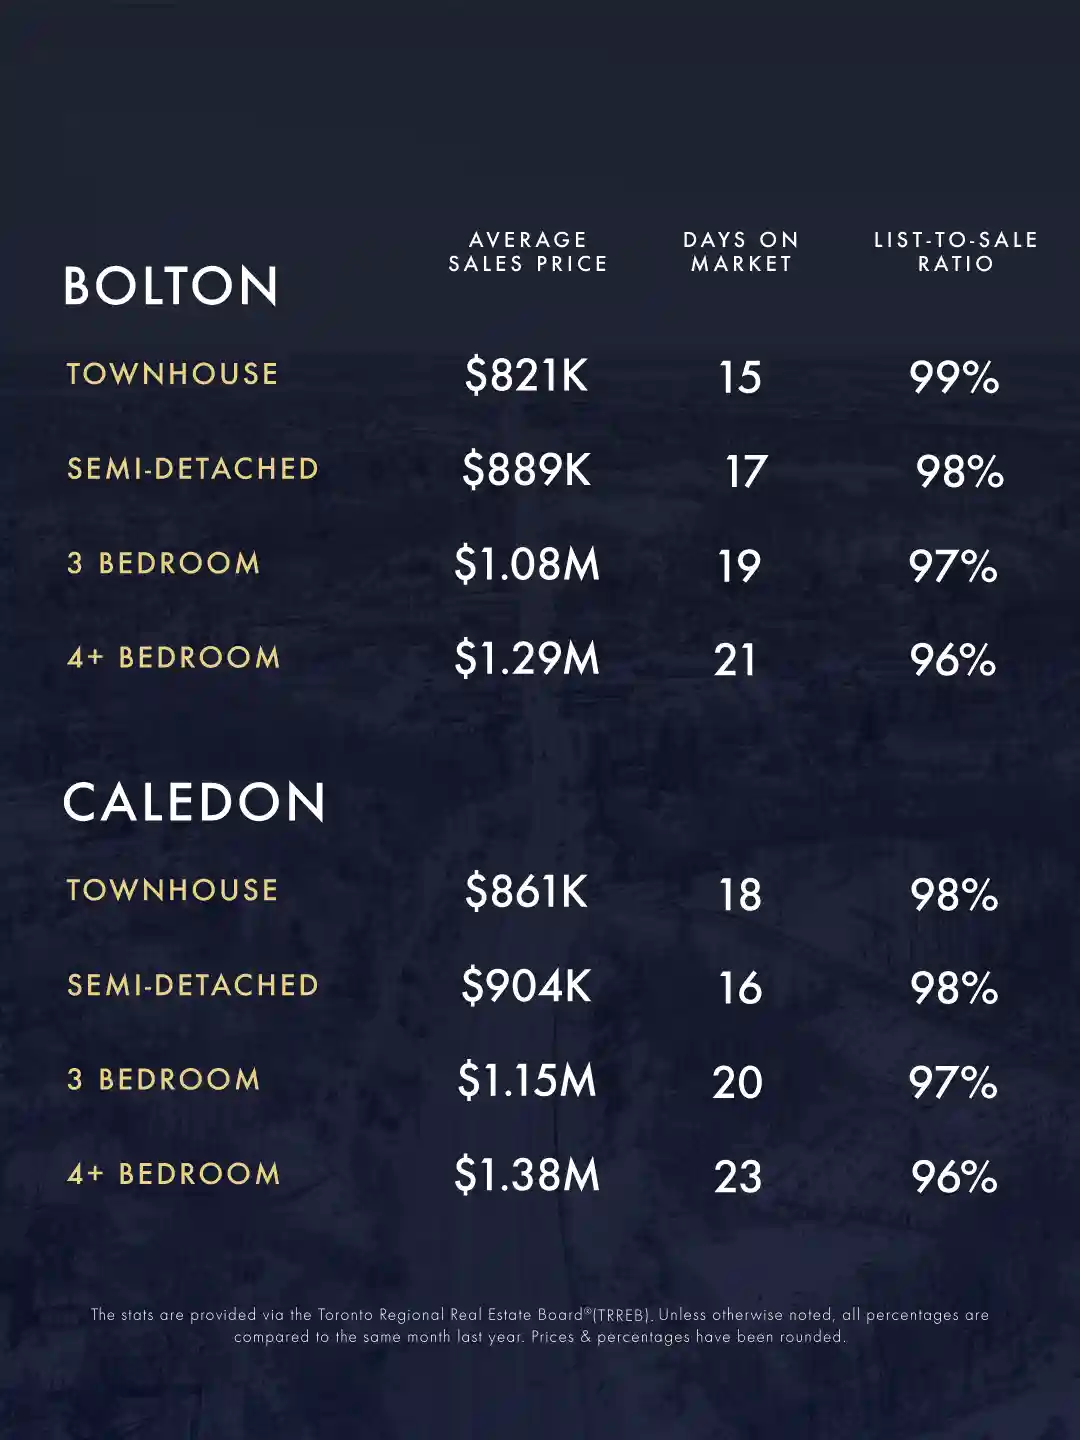
📍 Bolton Market Snapshot
Attached Townhomes:
- Avg. Sold Price: $820,250 | Avg. DOM: 15 | Avg. List-to-Sale: 99%
Semi-Detached:
- Avg. Sold Price: $888,500 | Avg. DOM: 17 | Avg. List-to-Sale: 98%
Detached (2–3 Bedrooms):
- Avg. Sold Price: $1,075,000 | Avg. DOM: 19 | Avg. List-to-Sale: 97%
Detached (4+ Bedrooms):
Avg. Sold Price: $1,285,750 | Avg. DOM: 21 | Avg. List-to-Sale: 96%
🏞 Caledon Market Snapshot
Attached Townhomes:
- 7 sales | Avg. Sold Price: $860,571 | Avg. DOM: 18 | Avg. List-to-Sale: 98%
Semi-Detached:
- 5 sales | Avg. Sold Price: $904,200 | Avg. DOM: 16 | Avg. List-to-Sale: 98%
Detached (2–3 Bedrooms):
- 9 sales | Avg. Sold Price: $1,152,222 | Avg. DOM: 20 | Avg. List-to-Sale: 97%
Detached (4+ Bedrooms):
- 15 sales | Avg. Sold Price: $1,375,533 | Avg. DOM: 23 | Avg. List-to-Sale: 96%
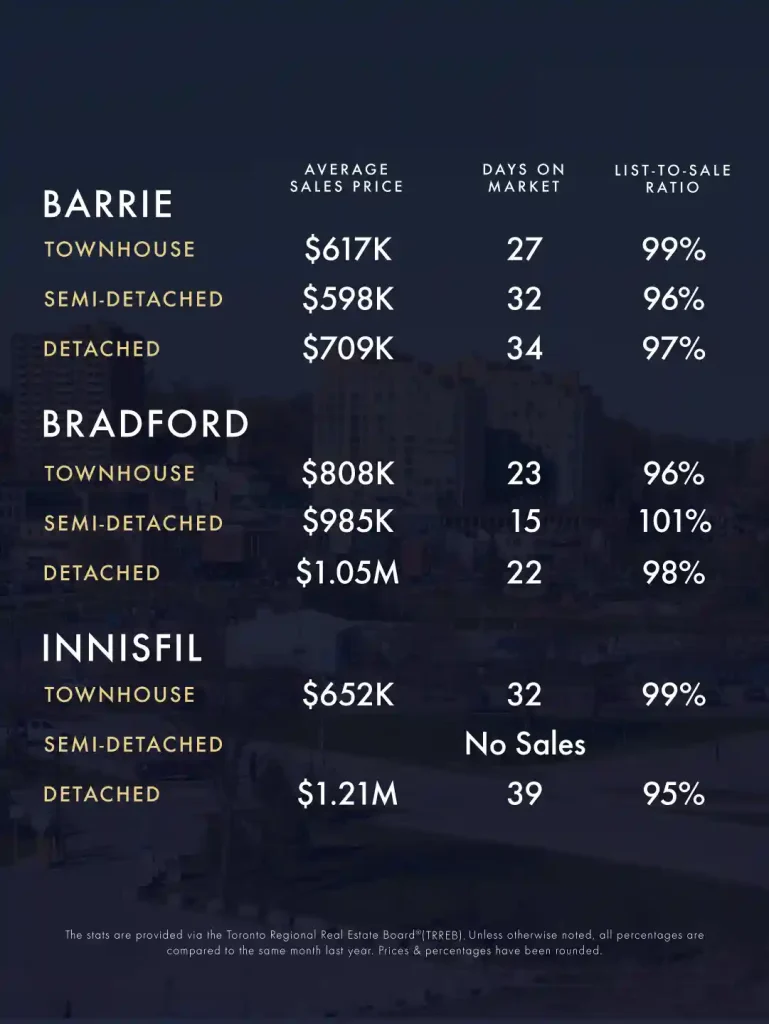
📍 Barrie Market Highlights – July 2025
Detached Homes
Avg. Price: $708,522
Avg. SP/LP: 97%
Avg. Days on Market: 34 days
Semi-Detached Homes
Avg. Price: $597,583
Avg. SP/LP: 96%
Avg. Days on Market: 32 days
Row/Townhomes
Avg. Price: $616,628
Avg. SP/LP: 99%
Avg. Days on Market: 27 days
📍 Bradford Market Highlights – July 2025
Detached Homes
Avg. Price: $1,054,832
Avg. SP/LP: 98%
Avg. Days on Market: 22 days
Semi-Detached Homes
Avg. Price: $985,000
Avg. SP/LP: 101%
Avg. Days on Market: 15 days
Row/Townhomes
Avg. Price: $808,287
Avg. SP/LP: 96%
Avg. Days on Market: 23 days
📍 Innisfil Market Highlights – July 2025
Detached Homes
Avg. Price: $1,211,786
Avg. SP/LP: 95%
Avg. Days on Market: 39 days
Semi-Detached Homes
None listed
Row/Townhomes
Avg. Price: $651,714
Avg. SP/LP: 99%
Avg. Days on Market: 32 days
Muskoka Housing Market Breakdown
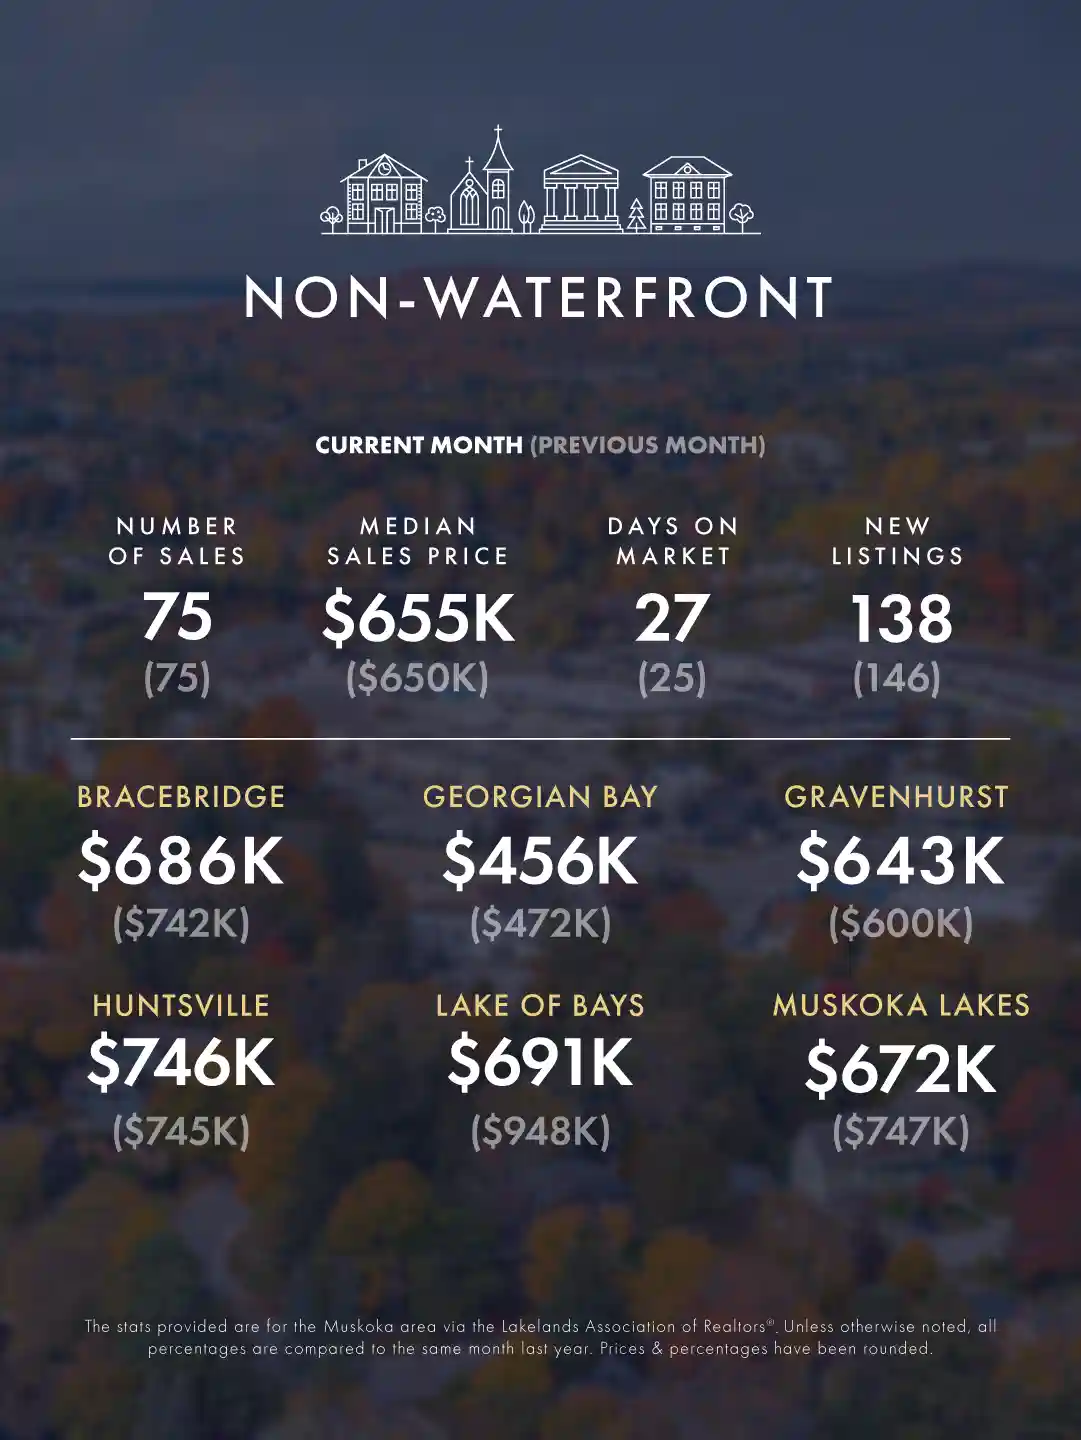
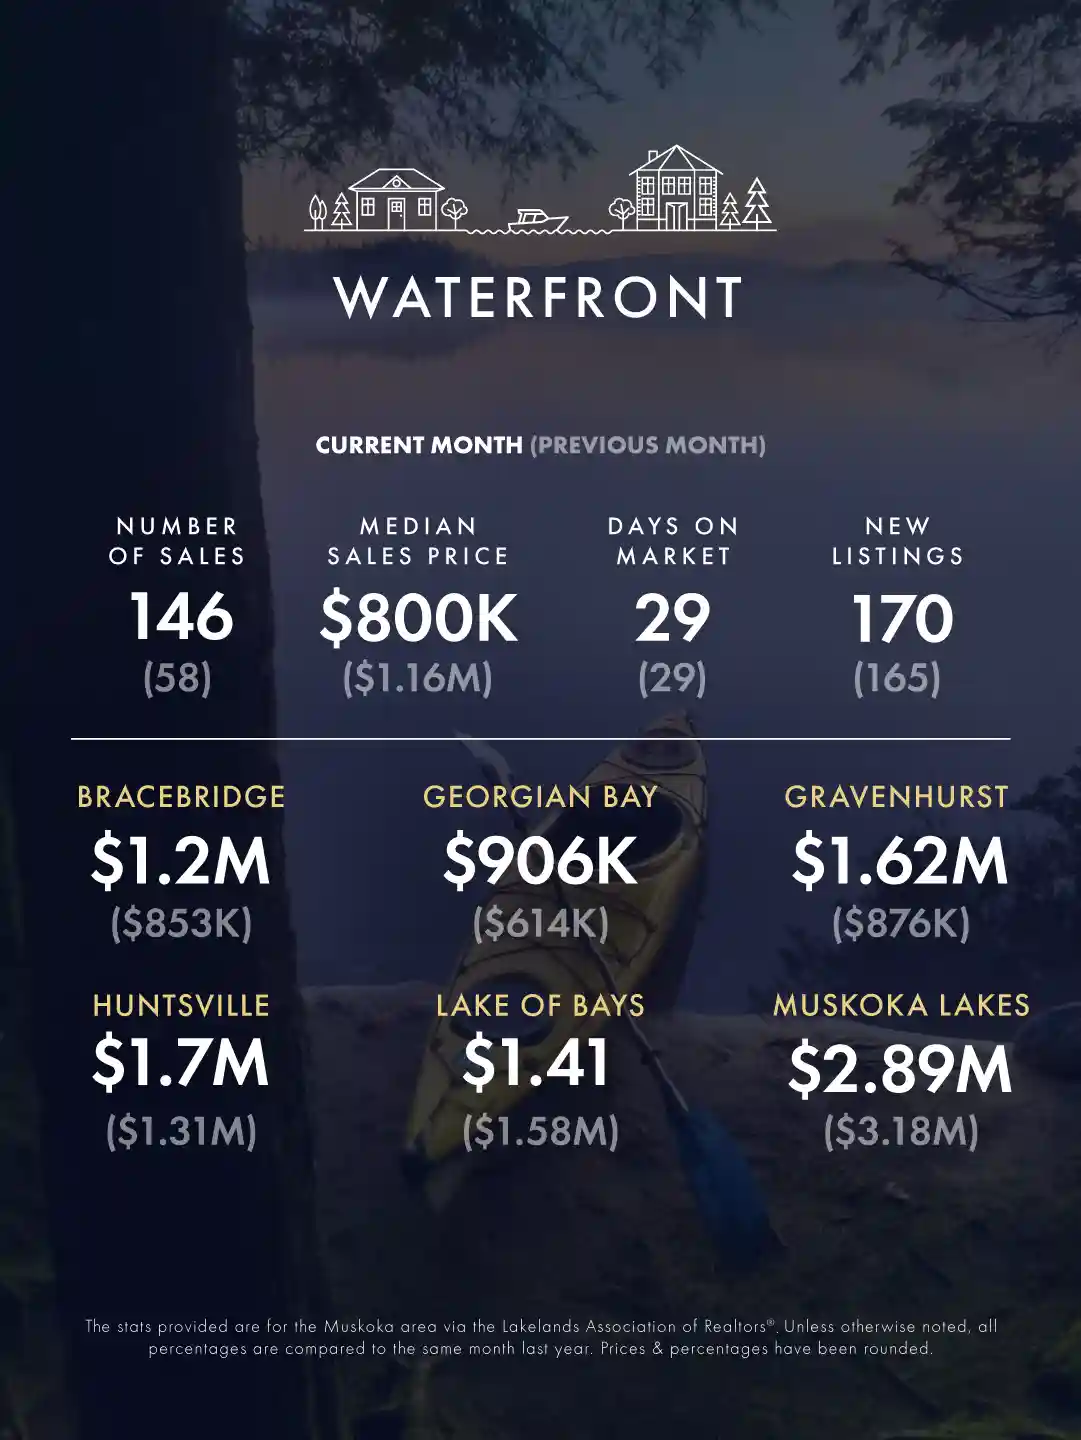
This Summer has been hot, very hot and it has kept folks wanting to find cool retreats to escape the heat. Muskoka cottages of all styles and sizes from lakeside to forest retreats and every option in between are waiting for new owners to love and cherish them. Non-waterfront home sales were steady at 75 (75 in June), while waterfront sales showed a huge jump to 146 (58 in June). It’s clear: Muskoka is calling, and buyers are answering.
💡 What This Means for Buyers & Sellers
Buyers: More selection and softer prices mean this is a prime time to find value — but the best homes don’t sit long. If you find the right fit, be prepared to move quickly.
Sellers: Sales are happening for reasonably and competitively priced properties. Today’s buyers are educated and quick to pass on overpriced homes. Pricing strategically from the start — supported by professional marketing — is what drives offers in this market.
📣 Let’s Create a Smart Market Plan—Together
If you’re considering selling this summer, here’s what you need:
✔ A team who knows your local market intimately
✔ Access to sold history beyond public websites
✔ A strategy rooted in real numbers, real timing, and real buyer behavior
🔍 Explore homes just listed in your area
🌐 www.katharineloucaidougroup.com
📩 Reply to this email to request a local report or schedule a free strategy call
🏠 Curious about your home’s value? Get your free estimate